
Seasonality 102: UK Mortality Heatmap since 1983
Seasonality 102: UK Mortality Heatmap since 1983
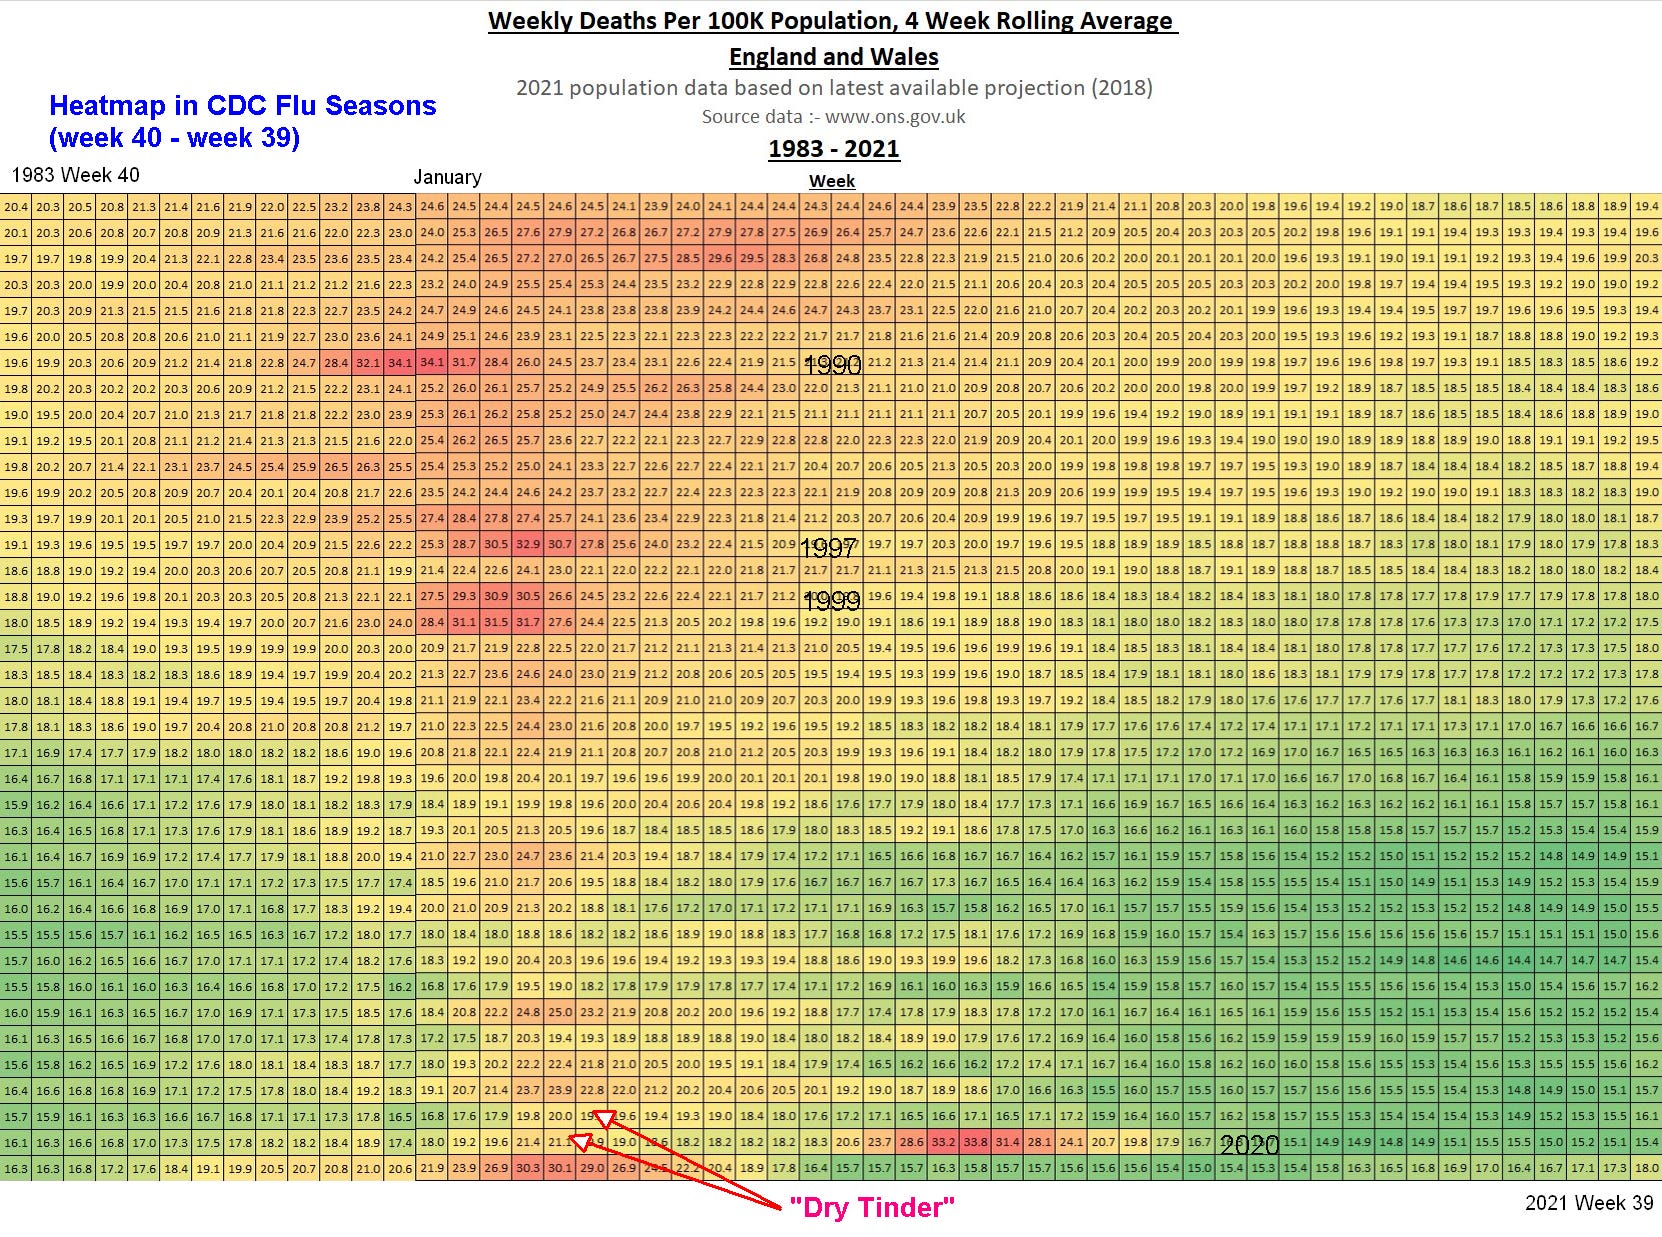
What if you map UK data to CDC FluView "PIC" week 40 to week 39 seasonality?

You get something where it’s easy to see that in a lens the width of the last 4 decades what we are experiencing is not unprecedented … even though they are trying to kill and maim everyone they can with Remdesivir and intubation.
Reformatted from the original by @OutsideAllan1:


Comparing these two, the reason that the CDC uses a week 40 to 39 seasonality is that as you can see strongly in 1989-90 but to some degree in most years, the impact of the normal winter peak can be divided across two calendar years relatively evenly thus potentially even nearly dividing in two the impact of a particular peak when looked at on a yearly basis if the adjoining year is mild.
The week 1 to 52 chart does actually show the split once you know to look for it but the year offset wraparound makes it a bit confusing.
But if you like lines instead of heatmaps then @OutsideAllan has you covered there as well:

And now that you know about the problem with the Jan 1 split it’s easy to notice that 89-90 was no joke for instance.
Finally, you can see both how much more green the chart becomes over time as mortality rates have come down in general and also how mild the 18-19 and 19-20 winters were from a mortality standpoint. This latter is yet more confirmation of @FatEmporer ‘s “Dry tinder” hypothesis that was mostly focused initially on Sweden (see “Sizing Sweden’s Setback“) but also pops out here.
I have not drilled into the ONS data to see if it’s properly age adjusted but if not then that just makes the visual case presented here an understatement. The older historical values should be HIGHER than shown here as the elderly population was proportionately smaller the further back you go in the records.