Virus Seasonality 201: Temperate/Tropical Eye Diagrams
Or: Don't ban me -- and Gavin Newsom too! -- for exposing the truth about virus seasonality!
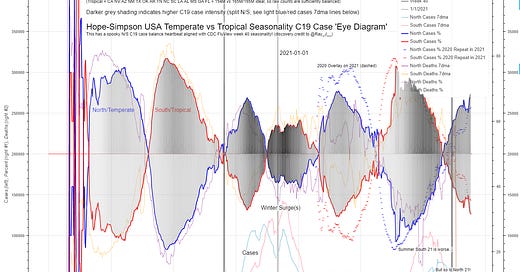
Based on a discovery by @Ray_J__ I now have this little beauty. Put it on as big of a monitor as you can find:
My take on what you need to know in summary:
C19 is not only seasonal but in the US it has two major zones of (Hope-Simpson) seasonal operation: temperate (northern states predominantly) and tropical (southern states predominantly). The overall US curve’s integration of these two zones have operated to obscure the existence of the zones.
Ray realized that not only was the 37th parallel a decent stab at a demarcation line between zones but it also divides the US population in half very closely so just allocating the cases from states (or even counties — see later links to T Coddington) without adjustments works for basic analysis purposes.
The light blue (north) and red (south) lines on the lower half of the chart are what results for cases for each zone. Intuitively it seems to show some differences but what? Is it really seasonal?
So Ray realized that you could also draw a derivative chart of the percentage split of cases between the north and south that had meaning given this even population split without resorting to any rate math and voila!: the “eye diagram” in the center of the chart that lands almost perfectly on the CDC’s FluView web app’s week 40 to week 39 yearly seasonality in four “eye” oscillation cycles per year!
And check out the dashed repeat in 2021 of the 2020 initial eye diagram — dead on repetition.
I also added case intensity grey shading to the eyes to echo the case curves — the darker that upper/lower half of the eye the higher the cases. The highest intensity is in the winter cycles just as you would expect.
And now you know why the CDC FluView site was updated a while ago to have a combined pneumonia + influenza + covid (“PIC” — no longer just “PI” alone) mode button on it. Don’t believe me? — take a look.
Not that Fauci would ever talk about this on CNN — just like he would never say he takes 6000 units of vitamin D daily as he actually wrote in an email to an enquirer a while back!
He’s laughing up his sleeve at you along with his Chinese masters.
Ray’s original discovery is here:


The trick in these discoveries is usually staring us in the face but you need to loosen up your brain and find the right derivative view. Kudos to Ray!
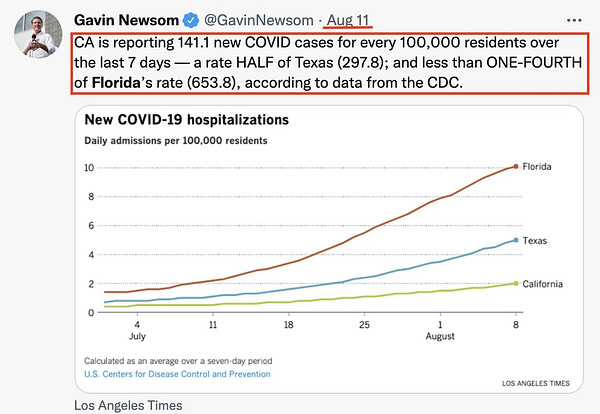
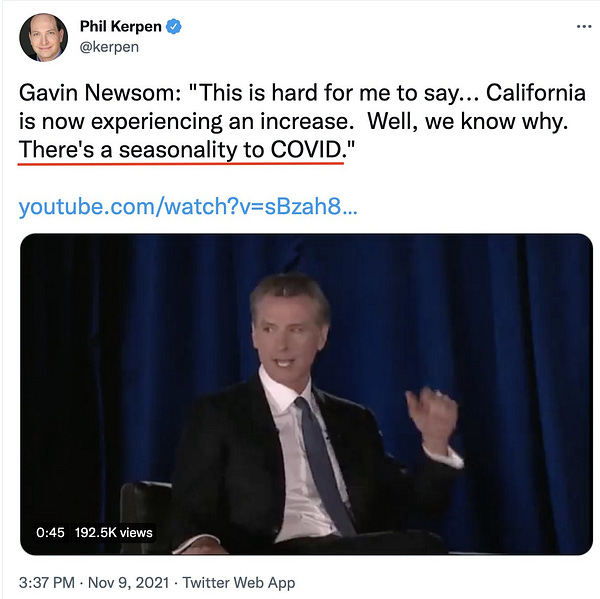
Dr. Hope-Simpson’s insights1 are so powerful that even Gavin seems to be conceding part of the field while still desperately clinging to his Cargo Cult Science:


Of course, Gavin’s tweeting next year about the next seasonal surge in FL will forget to mention seasonality since it isn’t to his advantage. Follow the science!
As a bonus check out T Coddington’s (@VanVoorheesVII) web dashboard enhancement that allows you to even slice counties by individual latitude to get some further surprising results2!


Maybe you can help extract T from the spooky hole he has dug.
Or fall in to the cavern with him LOL
Bonus: Even people more moronic than Gavin are starting to notice as @EWoodhouse7 points out re @EricTopol:
The bad cat also has a recent post on seasonality up here that also puts a big thumb in the eye of the effectiveness of the vaccs.
To be clear, seasonality is driven by a long list of factors (temperature, humidity, sunlight/ vitamin D, level of existing population immunity build up/ endemicity from the waves, etc) that have been poorly studied or even ignored since their potential for big pharma profits is — shall we say — limited? And given this, the exact dividing lines for seasonality zones need a lot more research. Ray’s discovery is just the kind of “accident” that many major breakthroughs come from…


