

Gimme a U! Gimme an S!
Is the US starting to show a "pull forward" deaths effect even with lockdown death "chaffe"? (And much, much more...)

Well, this is interesting. Not time to buy it is real yet but interesting:

I have previously said in various flavors that the Faucist/Xi virus plan was to not only knock off (“harvest” in the vernacular) the old, sick and fat to reduce the US budget’s SS/Medicare uncovered liabilities but to also blow a hole in the Trump voter base while converting the world into a CCP vassal state. That continues on course with the latest addition of the \/x weapon.
BTW, here’s an eye opener in the \/x weapon regard. Whether his overall theory on how bad the damage will be from these “wrong” \/x’s is correct in detail or not (hopefully not or things will get ugly and then even more ugly), I think we can all agree that this is a h*ll of an education on the immune system including loads on innate immunity mechanisms that you will definitely never see on XiNN.
(Pause for depression about the future of humankind…) What was I saying again?
Oh, yeah. Gimme a U! Two things about that first chart:
Notice my annotation that we may finally in spite of Fauci/Xi’s (FX from now on) best efforts at mass murder be seeing a “pull forward” effect where all cause deaths in the very elderly start to fall below the recent historical curves. If this does continue to show up noticeably above the 4-8 week reporting lag, my guess is it will be minimal and short lived since the lockdown fallout of missed cancer diagnoses, etc. will quickly “fill in the hole”. I have to give FX credit for studying their Machiavelli…
Notice also that only the older brackets have the “U” shape in the grey historical deaths curves that drives the…
Gimme an S! … all cause deaths sine wave shape I have pointed out many times that illustrates mainly virus seasonality — the sine shape is driven by the OLD and not the young (younger grey deaths history lines are flat!). That U over many years becomes the roughly sine shape of the green actual deaths bars and orange (and heavily gamed) predicted line.

That “U” and resulting sine have traditionally been attributed heavily to the seasonality of the flu and viruses in general. You do realize that the CDC has always admitted to virus seasonality but they have gone mute about it for the last year since that now serves their purposes to panic the lemmings? They really have your health in mind you know…
As seasonality exhibit Alpha and Omega I give you the CDC FluView interactive page which explicitly describes “PI seasons” (pneumonia and influenza) as week 40 to week 39 rather than week 1 to week 52 as one would expect if there was no need to account for any seasonality!
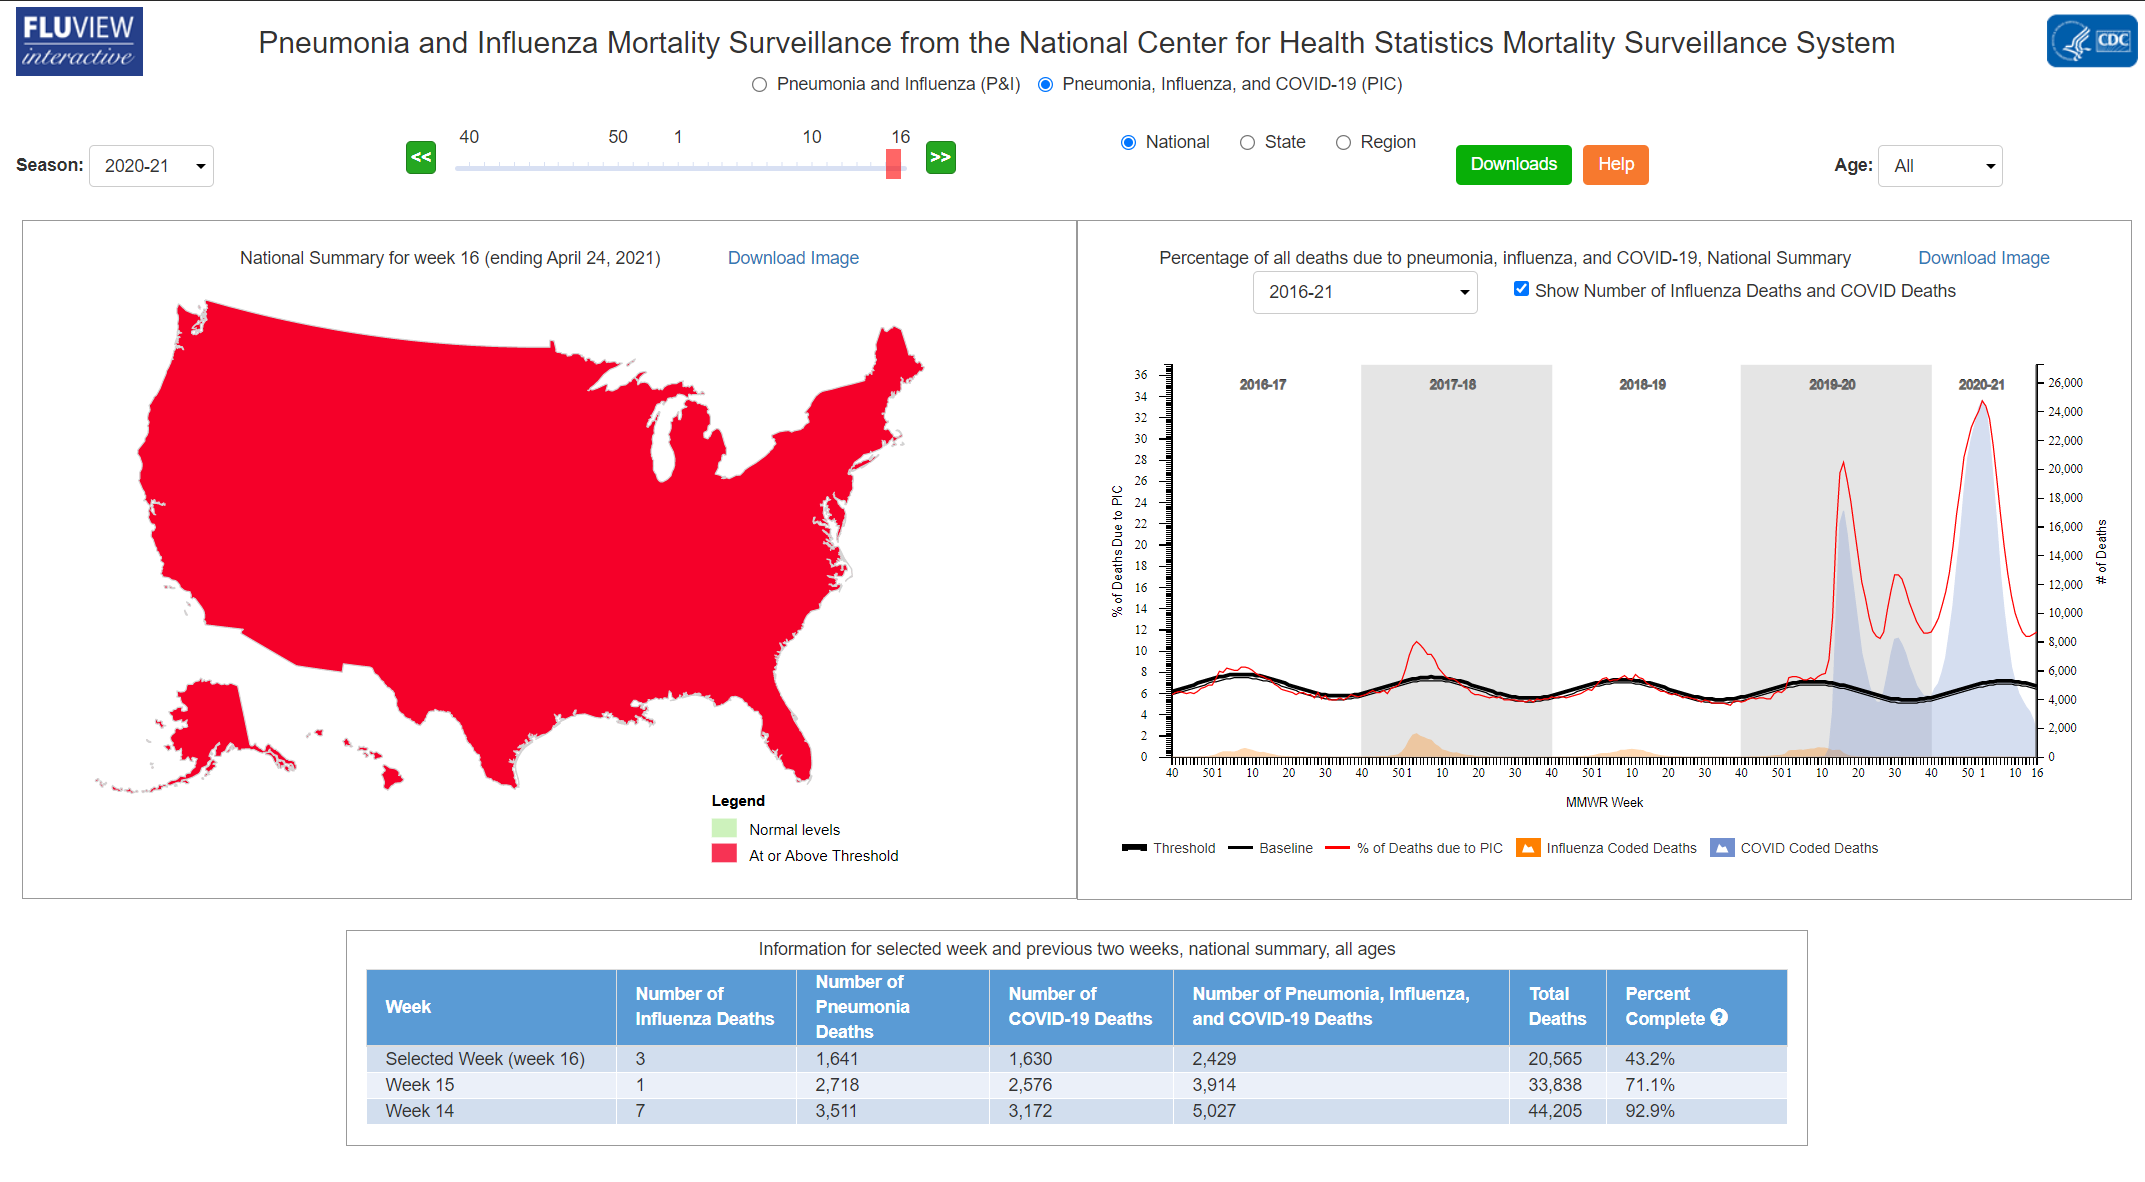
Silly me! Now it defaults to “PIC” (pneumonia, influenza and Covid) season view instead of “PI” view! Of course that must have been an oversight on their part and Covid is not really seasonal also?
Riiight. … You. Are. Being. Scammed.
And did I forget to mention that the flu is gone also? And until about the last month so have been the 4 pre-existing cold causing coronaviruses that along with the flu traditionally account for 100-400 million infections each year in the gimme a U! gimme an S? But don’t worry, according to the (FX Gates) WorldOMeter it only took 33M US C19 infections to date to displace all of that! No disinformation there.

Did I forget to mention that this is the biggest psy-op in world history?
Oh, well.
A key ending take away on virus seasonality is to keep watching the C19 and excess death curves for bumps that are not in line with seasonality (the southern US adds a “northern tropical” summer seasonality bump that needs to be accounted for as we now understand happened last year) as that may mean that Geert is even smarter than we fear after watching that interview.
Did I forget to mention India?


